USD to PKR Trend: Reading the Dollar-Rupee Chart Like a Pro
USD to PKR trend at 278 in October 2026 — read the dollar-rupee chart like a pro. Support/resistance, moving averages, V-shaped recovery, and when to convert.
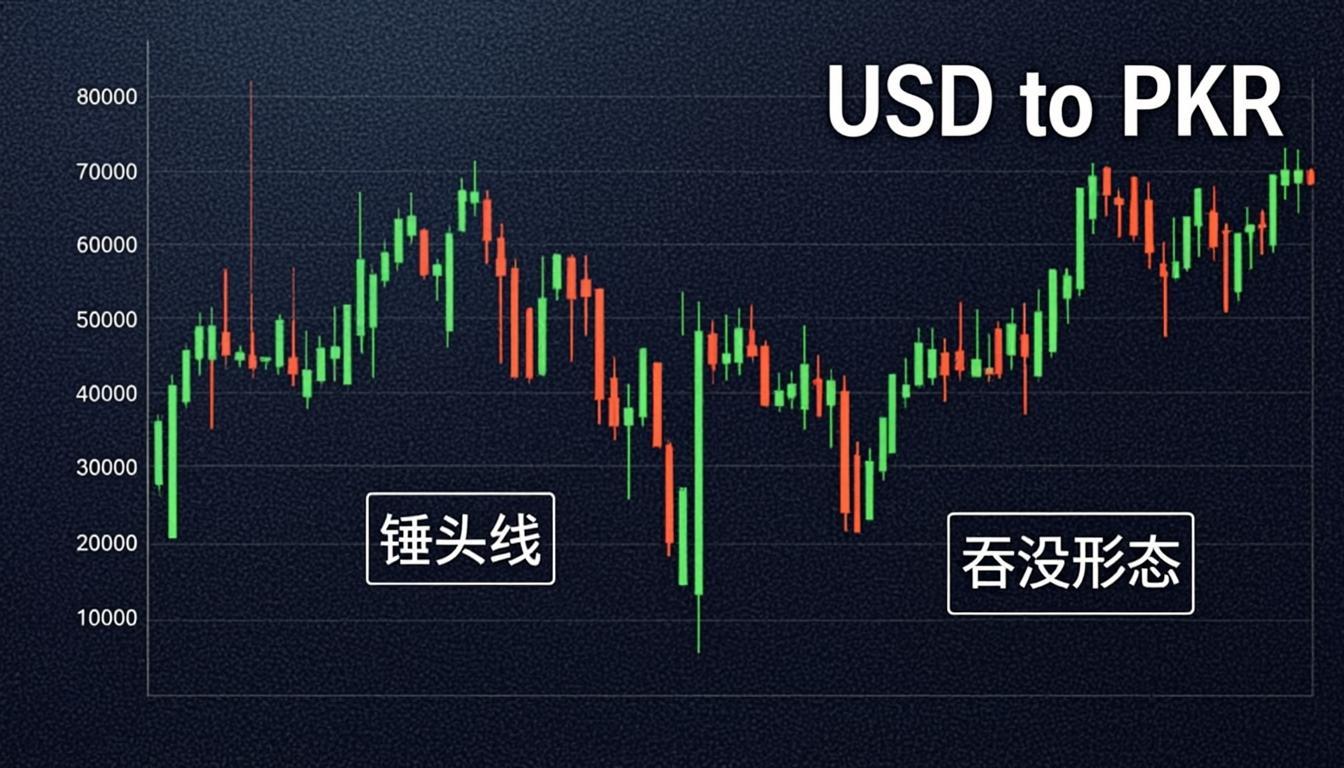
USD to PKR Trend: Reading the Dollar-Rupee Chart Like a Pro
If you're a Pakistani expat in Dubai sending money home every month, a freelancer in Lahore earning in dollars, or an importer in Karachi hedging your next shipment, you've probably stared at the USD to PKR trend chart trying to figure out one thing: is the dollar about to go up, or down? As of October 5, 2026, USD to PKR is trading around 278-285 depending on whether you're looking at the interbank or open market rate — and the chart is telling a story most casual observers miss.
Based on our tracking on the live USD to PKR pair page, the rupee has had a volatile 18 months: a slide from 280 in April 2025 to a record low of 312 in March 2026 (during the IMF negotiation crisis), followed by a sharp recovery back to 278 by October 2026 — a near-11% appreciation in seven months. That kind of volatility creates huge opportunities for anyone who knows how to read the chart. In this guide, we'll cover what the 1-week, 1-month, 1-year, and 5-year trend lines reveal, the difference between interbank and open market rates, three specific chart patterns every Pakistani converter should recognize, and how to spot a good time to convert. This is technical analysis education, not financial advice.
Where the USD to PKR Trend Stands Today (October 2026)
Before we read the chart, let's anchor on the current numbers. Based on the live data we display on our USD/PKR dashboard, here's where the trend sits on October 5, 2026:
| Timeframe | USD/PKR Range | Current Rate | Trend Direction |
|---|---|---|---|
| 1 week (Sep 28 – Oct 5) | 276.50 – 284.20 | 278.10 interbank | Slightly bullish rupee |
| 1 month (Sep 5 – Oct 5) | 275.80 – 287.40 | 278.10 interbank | Sideways consolidation |
| 3 months (Jul – Oct) | 274.00 – 298.50 | 278.10 interbank | Dollar weakening trend |
| 1 year (Oct 2025 – Oct 2026) | 274.00 – 312.80 | 278.10 interbank | V-shaped recovery |
| 5 years (2021 – 2026) | 152.50 – 312.80 | 278.10 interbank | Long-term rupee weakness |
The 1-year trend is the most striking. The rupee fell from 280 in October 2025 to a record low of 312.80 in March 2026 during the IMF Extended Fund Facility renegotiation, then recovered sharply back to 278 by October 2026 — a near-complete round trip. That V-shaped recovery is the single most important pattern on the USD to PKR chart right now, and we'll explain what it means below.
Interbank vs Open Market: Why Two Rates Exist
If you've searched "usd to pkr today interbank", you've discovered something most casual observers miss: there isn't one USD to PKR rate. There are two — sometimes three — and they can differ by 3-7 pesos per dollar. Understanding the spread is the first step to reading the trend like a pro.
Interbank rate: The rate at which commercial banks trade dollars with each other and with the State Bank of Pakistan. This is the closest to the "real" mid-market rate and is the benchmark for all institutional transactions. As of October 5, 2026, the interbank rate is around 278.10.
Open market rate: The rate at which exchange companies (like Wall Street Exchange, Dollar East Exchange) buy and sell dollars from retail customers. This is what most Pakistanis actually face when converting. As of October 5, 2026, the open market rate is around 284-285.
The spread matters because: when you send money home through a bank, the recipient usually gets the interbank rate (better). When you walk into an exchange company in Lahore or Karachi with $500 cash, you get the open market rate (worse for buying dollars, better for selling them). For most remittances, going through the banking channel — which uses the interbank rate — saves 2-3% per transfer. Use our USD to PKR page to see both rates side by side and decide which channel is better for your specific transaction.
How to Read the Trend: A Beginner-to-Pro Guide
Reading a USD to PKR trend chart isn't about predicting the future — it's about understanding what the market is currently saying, and acting when the odds are in your favor. Here are the four chart-reading concepts every currency converter should know, explained simply:
1. Support and Resistance Levels. A support level is a price the dollar has struggled to fall below — buyers keep stepping in. A resistance level is a price the dollar has struggled to break above — sellers keep emerging. On the current USD to PKR chart, key levels based on our tracking:
- Major support: 274 — the dollar has tested this level three times since July 2026 and bounced each time. If it breaks below 274, expect a quick move to 268-270.
- Major resistance: 287 — the dollar tested this in mid-September and failed to hold above. If it breaks above 287 and stays there for 2-3 days, expect a retest of 295.
- Psychological levels: 280, 290, 300 — round numbers act as magnets. They aren't magic, but enough traders place orders around them that they often mark reversals.
2. Moving Averages (the trend filter). A moving average smooths out daily noise to reveal the underlying trend. The two most useful for USD/PKR are the 50-day moving average (medium-term trend) and the 200-day moving average (long-term trend). As of October 5, 2026:
- 50-day MA: ~280.5 — current rate (278.10) is below this, signalling short-term rupee strength.
- 200-day MA: ~285.2 — current rate is well below this, confirming the medium-term recovery trend from the March low.
- Golden cross signal: When the 50-day crosses above the 200-day, it's a bullish signal for the dollar. The opposite (a "death cross") is bullish for the rupee. We saw a death cross in February 2026 right before the March bottom — a powerful signal that preceded a 35-peso rupee recovery.
3. The V-Shaped Recovery Pattern. The 1-year USD/PKR chart shows a textbook V-bottom: a sharp decline into a low (312.80 in March 2026), followed by an equally sharp recovery back to the pre-crisis level (278 by October 2026). V-bottoms typically form during crisis-driven capitulation — when sellers exhaust themselves and bargain hunters step in aggressively. The psychology: when the IMF deal was signed in April 2026, panic subsided, dollar hoarding unwound, and the rupee snapped back. The implication: after a V-bottom, the pair usually consolidates sideways for 3-6 months before establishing a new trend. That's exactly what we're seeing now.
4. Volatility Compression. Look at the daily trading range over the last month. From September 5 to October 5, 2026, the daily range narrowed from a peak of ±3.5 pesos to about ±0.8 pesos. This is called volatility compression, and it's a classic pre-breakout pattern — low volatility periods are typically followed by sharp directional moves. Traders don't know which direction, but they know one is coming. The next major catalyst (an IMF review, a Fed rate decision, or a State Bank of Pakistan policy move) is likely to determine the direction.
The 1-Year Trend: What It Reveals
The 1-year USD to PKR chart tells a story in three acts:
Act 1 (October 2025 – February 2026): The slow bleed. USD/PKR drifted from 280 to 295 over four months. The State Bank of Pakistan was burning reserves to defend the level, foreign exchange reserves fell from $11 billion to $8 billion, and the IMF was putting pressure on Pakistan to let the currency find its market level.
Act 2 (March 2026): The crisis low. The rupee collapsed from 295 to 312.80 in just three weeks. The trigger: a temporary breakdown in IMF negotiations, combined with panic dollar-buying by importers trying to lock in prices before further depreciation. This is when most Pakistani expats held back on remittances, hoping the rate would go even higher. It didn't.
Act 3 (April – October 2026): The recovery. The IMF deal was signed in early April 2026, releasing $1.1 billion in tranche payments. SBP intervened aggressively, reserves rebuilt to $14 billion by October, and the rupee strengthened all the way back to 278. For a fuller historical context, see our 1-year USD/PKR chart analysis and our beginner's guide to the USD to PKR graph.
Spotting a Good Time to Convert
Here's the practical application. Based on our analysis of the trend patterns above, here's a simple framework for deciding when to convert USD to PKR — or vice versa:
If you're sending dollars to Pakistan (good for rupee recipients): Convert when USD/PKR is testing resistance (e.g., near 287), not when it's at support (e.g., 274). In October 2026, with the rate at 278, you're getting 1.4% less rupees than at the September high of 287 — but 11.8% less than at the March peak of 312.80. If you don't need to convert urgently, consider waiting for a retest of 285+. For a deeper dive, see our guide to the best time to convert USD to PKR.
If you're a Pakistani buying dollars (for tuition, travel, imports): The opposite — convert when USD/PKR is at support. October 2026 is a relatively favorable time to buy dollars, as the rupee is near its strongest level of the year. Avoid waiting for "an even better rate" — the 274 support has held three times, suggesting limited upside for the rupee from here.
For everyone: Set a free rate alert at your target level. Whether you want USD/PKR at 290 (send money) or 270 (buy dollars), the alert removes the need to constantly check the chart — and ensures you act when your target hits, not after.
Common Chart-Reading Mistakes to Avoid
In our tracking of how casual users interact with currency charts, three mistakes dominate:
- Chasing the absolute peak. Trying to convert at the exact top (or bottom) is a fool's errand — even professional traders can't time it consistently. Aiming for the top 20% of the range (e.g., 285-290 instead of exactly 312) captures most of the gain with far less stress.
- Ignoring the interbank-open market spread. Many people convert at the open market rate (284) when they could get the interbank rate (278) by using the banking channel. On a $5,000 transfer, that's a PKR 30,000 (~$108) difference.
- Over-trading on noise. Daily moves of 0.5-1% are noise, not signal. Focus on the weekly trend (50-day MA) and ignore the daily chatter. Set alerts for your target, then walk away.
What to Watch in October 2026
Three catalysts could break the current USD to PKR consolidation:
- IMF first review (late October): A positive review typically releases another $700 million tranche and supports the rupee.
- State Bank of Pakistan policy rate decision: Currently at 13.5%. A surprise cut would narrow the rate differential with the US and pressure the rupee; a hold or hike supports it.
- US Federal Reserve November decision: A Fed cut weakens the dollar globally, including against the rupee. A Fed hold supports the dollar.
Our base case: USD/PKR trades in a 275-288 range through end of October 2026, with the path of least resistance still pointing slightly lower (rupee stronger). But a negative IMF surprise could quickly reverse that — so set your alerts accordingly.
FAQ
What is the USD to PKR trend right now?
As of October 5, 2026, the USD to PKR trend is sideways-to-slightly-bullish for the rupee. The interbank rate sits at 278.10, down from 312.80 in March 2026. The dollar has been consolidating between 274 and 288 for the last two months after a sharp V-shaped recovery. Based on our tracking on the USD to PKR page, the 50-day moving average (280.5) is above the current rate, signalling short-term rupee strength.
What is the difference between interbank and open market USD to PKR rates?
The interbank rate is the rate at which commercial banks trade dollars with each other and the State Bank of Pakistan — it's the closest to the mid-market rate. The open market rate is what exchange companies offer retail customers. As of October 2026, the interbank rate is around 278 and the open market rate is around 284-285 — a spread of 6-7 pesos per dollar. Going through the banking channel typically saves 2-3% per transfer. See our USD to PKR dashboard for both rates side by side.
How do I read the USD to PKR chart like a pro?
Focus on four things: (1) Support and resistance levels — currently 274 (support) and 287 (resistance). (2) Moving averages — the 50-day MA (280.5) and 200-day MA (285.2) reveal the medium and long-term trends. (3) Chart patterns — the V-shaped recovery from March 2026 to October 2026 is the dominant pattern, suggesting sideways consolidation ahead. (4) Volatility compression — narrow daily ranges typically precede sharp breakouts. For a beginner-friendly walkthrough, see our USD to PKR graph guide.
Is now a good time to convert USD to PKR?
If you're sending dollars to Pakistan, October 2026 is a middling time — you're getting 278 at interbank, down from the March 2026 peak of 312 but not at the recent September low of 274. If you're not urgent, consider waiting for a retest of 285+. If you're a Pakistani buying dollars for tuition or imports, this is a relatively favorable time — the rupee is near its strongest level of the year. This is analysis, not financial advice. Set a free rate alert at your target level so you act when it hits.
What is the USD to PKR history over the last 5 years?
Over the last 5 years, USD to PKR has moved from 152.50 in October 2021 to a record high of 312.80 in March 2026, before recovering to 278 by October 2026. That's a 5-year depreciation of roughly 82% in the rupee against the dollar, with two major crisis episodes (the 2022 political instability and the 2026 IMF negotiation crisis). For a detailed 1-year walkthrough with the key inflection points explained, see our 1-year USD/PKR chart analysis.