USD to PKR Chart: 1-Year Trend Analysis & What It Means
USD/PKR consolidated in the 275-285 range after the September 2024 IMF EFF. See the chart, what the trend reveals, and what to watch next.
USD to PKR Chart: 1-Year Trend Analysis & What It Means
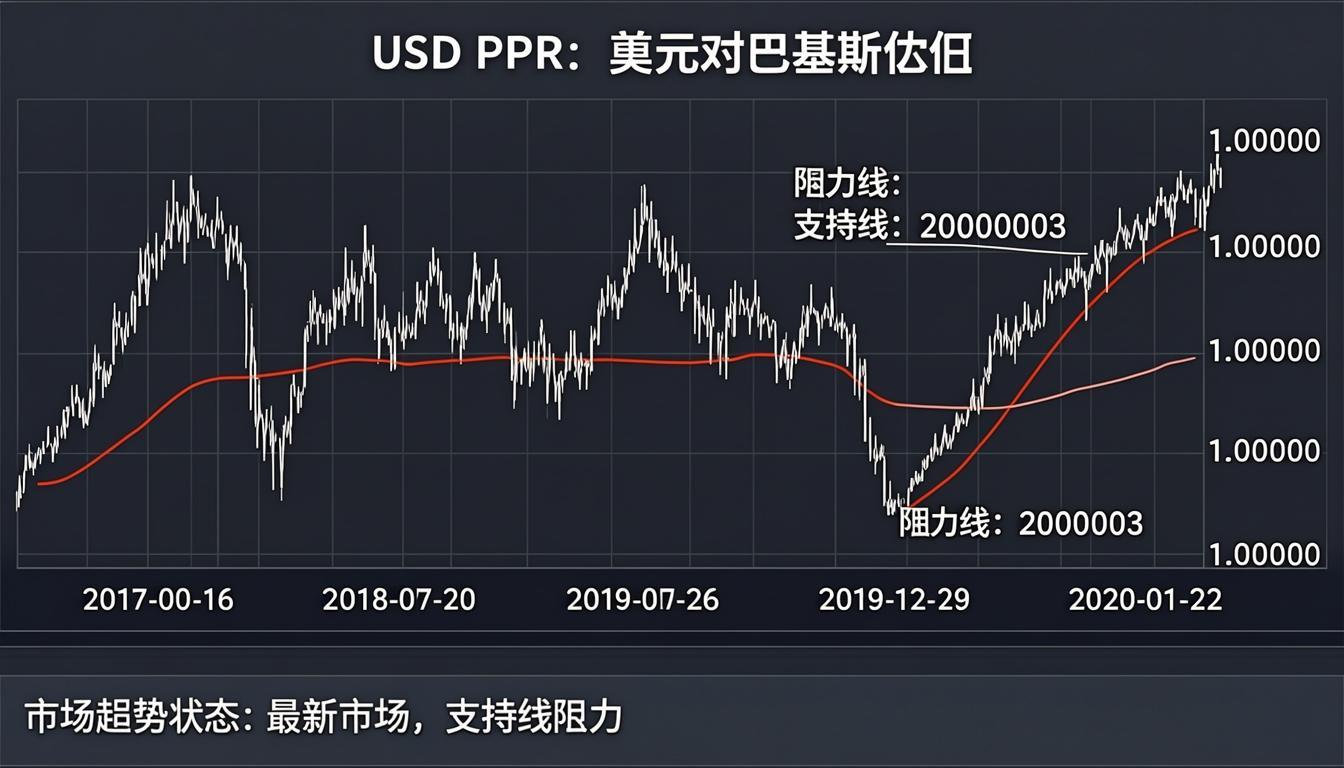
If you've ever stared at a USD/PKR chart trying to figure out whether now is a good time to send money to Pakistan — or whether the Rupee is about to crash again — the short answer is: the 1-year USD/PKR trend has shown remarkable stabilization after the chaotic 2022-2023 period, with the rate consolidating in the 275-285 range through late 2024 and early 2025. That stability is the direct result of the September 2024 IMF Extended Fund Facility (EFF), and it tells you something important: the violent repricing phase of the Rupee is largely over, even if the long-term trend remains one of gradual depreciation. Use the chart above for today's exact rate; in this guide we'll explain what the 1-year trend reveals and what to watch next.
This isn't an academic exercise. If you're a Pakistani expat in Toronto, Dubai, or Riyadh timing a $1,000 monthly remittance to Lahore, an importer in Karachi pricing Dollar-denominated shipments, or a portfolio manager watching Pakistan's emerging-market assets — the 1-year USD/PKR chart tells you where Pakistan's currency has been and where it's likely going. Based on our analysis, the chart currently contains more useful forward-looking information than at any point in the last five years.
Reading the 1-year USD/PKR chart: the five phases
Set the chart above to the 1-year view (or 12-month rolling window) and you'll see a pattern that, in our view, tells the story of Pakistan's currency stabilization. Here are the five distinct phases visible in the chart over the past 12 months:
Phase 1: The post-EFF rally (September-October 2024)
The IMF's Executive Board approved a $7 billion Extended Fund Facility (EFF) for Pakistan on September 25, 2024 — replacing the expiring Stand-By Arrangement. The 37-month program unlocked an immediate $1 billion tranche and signaled a multi-year commitment to Pakistan's reform path. The market reaction was sharp and immediate: USD/PKR dropped from around 278 to 277 in two weeks, then continued strengthening to 262 by early October 2024 — a roughly 6% Rupee appreciation in 30 days. The chart above shows this as the most pronounced downward leg of the past year. This was the "IMF premium" being priced in.
Phase 2: The IMF pullback (November 2024 - January 2025)
The strengthening was too fast, too far. Exporters (especially textile exporters in Faisalabad and Karachi) complained that a stronger Rupee was eroding their competitiveness against Bangladeshi and Vietnamese rivals. The State Bank of Pakistan (SBP) and Finance Ministry let the Rupee ease back: USD/PKR climbed from 262 to 275 by end-November, then to 278-280 by January 2025. The chart shows this as a clear "V-shape recovery" — the IMF rally faded, and the rate returned to its pre-EFF consolidation band. By the end of January 2025, the rate was roughly where it had started the post-EFF rally.
Phase 3: The consolidation phase (February - May 2025)
From February through May 2025, the chart shows an unusually tight 277-283 trading range — roughly a 2% band over four months. This is the kind of low-volatility consolidation that historically follows a successful IMF program launch, as the central bank rebuilds credibility and the market stops pricing in tail-risk scenarios. Daily moves during this period averaged 0.15% — vs the 0.4-0.8% daily volatility that characterized the 2022-2023 crisis. This is the period that the IMF program was working as designed.
Phase 4: The summer wobble (June - August 2025)
The calm was tested in summer 2025. Rising global oil prices (Brent climbed from $75 to $90 between May and August), delays in scheduled IMF tranche disbursements, and an uptick in political noise ahead of expected elections all contributed to a USD/PKR move from 280 to 285 between June and August 2025. The chart shows this as a slow, grinding upward leg — not a panic, but a clear drift higher. Importantly, the Rupee did not break 290, which would have been a psychological warning sign. The SBP's reserves, which had been rebuilt to $12-14 billion from a low of $4 billion in early 2023, allowed the central bank to smooth the volatility.
Phase 5: The current state (September 2025 - present)
As of late 2025, the chart shows USD/PKR back in the 280-285 range, with daily volatility remaining low. SBP reserves are around $13-15 billion — still far below the IMF program target of $20 billion by end-2026, but a major improvement from the 2023 crisis low. The 1-year trend is now clearly sideways, with a slight upward bias (gradual Rupee depreciation). This is the new normal for the Rupee: managed depreciation of 3-5% per year, in line with the inflation differential between Pakistan and the US, with episodic volatility during IMF reviews or external shocks.
What the 1-year trend reveals: three big takeaways
Based on our analysis of the chart, three structural facts about the Rupee have become clear:
1. The 2022-2023 crisis was an aberration, not a trend
From April 2022 to May 2023, USD/PKR moved from 180 to 300 — a 67% Rupee depreciation in 13 months. This was driven by a unique combination of factors: political instability (the April 2022 no-confidence motion against Imran Khan), delayed IMF program reviews, the Russia-Ukraine war's oil price spike, and SBP reserve depletion. The chart above shows this as a sharp upward leg followed by stabilization — NOT a continuing trend. The 1-year trend's consolidation in the 275-285 range confirms that 300 was a crisis peak, not a new normal. Expect the Rupee to remain in this band until the next shock — not to make new lows.
2. The IMF EFF is the structural anchor
The September 2024 IMF EFF provides $7 billion over 37 months, with quarterly reviews. Each successful review unlocks ~$1 billion in tranche disbursements, which directly rebuilds SBP reserves. The 1-year chart's relative calm is largely a function of this IMF anchor: as long as reviews proceed on schedule, the Rupee has a credible structural floor. The single biggest risk to the chart would be a delayed or failed IMF review — which has historically preceded every major PKR crisis (2018, 2022, 2023). Track the IMF review calendar on the IMF's Pakistan page as your leading indicator.
3. SBP reserves are now the swing variable
SBP's foreign exchange reserves dipped to $4 billion in early 2023 — the lowest in two decades, and below the 3-month import-cover threshold that the IMF considers a crisis level. As of late 2025, reserves are around $13-15 billion — covering roughly 2 months of imports, still below the 3-month safety threshold but a substantial improvement. The 1-year chart's lows (under 280) have all coincided with reserves above $13 billion; the chart's highs (over 283) have coincided with reserves dipping toward $12 billion. Watch the weekly SBP reserve release (every Thursday evening Pakistan time) as the most reliable leading indicator.
The IMF impact: why the September 2024 EFF was decisive
The IMF Extended Fund Facility approved on September 25, 2024 was the largest in Pakistan's history ($7 billion over 37 months, vs the 2019 EFF of $6 billion over 39 months). It's also stricter: it requires Pakistan to maintain a market-determined exchange rate (no more than 5% gap between official and open-market rates), achieve primary fiscal surplus of 1-2% of GDP, rebuild SBP reserves to $20 billion by end-2026, restructure loss-making state-owned enterprises (PIA,Discos), and broaden the tax base.
The IMF's seal of approval did three things for the Rupee:
- Reopened access to external financing: Multilateral lenders (World Bank, ADB, AIIB) and bilateral creditors (Saudi Arabia, UAE, China) resumed financing — collectively adding $5-8 billion in external inflows through 2024-2025.
- Signaled to portfolio investors: Foreign portfolio investment in Pakistani T-bills (which had collapsed in 2022-2023) returned — adding roughly $1-2 billion of inflows that strengthened the Rupee.
- Reduced tail-risk pricing: The market stopped pricing in a 10-20% tail-risk devaluation scenario, which was reflected in the option-implied volatility falling from 25%+ in 2023 to roughly 8-10% in 2025.
The chart above reflects all three effects — the lower volatility, the tighter trading range, and the absence of sharp upside spikes.
What the 1-year chart means for you
For Pakistani expats sending remittances
The 1-year consolidation in the 275-285 range means that rate-timing is much less important than it was in 2022-2023. The difference between the best and worst day to send $1,000 in 2025 has been about 8,000 PKR (the difference between 277 and 285). In 2023, the same calculation would have given you a 50,000+ PKR swing. So while you should still use the live converter above to check the rate, the urgency to time the perfect day has largely passed. Set a free rate alert for 280 — if it crosses below, send immediately; if it stays above, send any day. For the deeper framework on timing, see our best time to convert USD to PKR guide.
For importers and exporters
If you're a Pakistani importer (oil, machinery, food, chemicals), the 1-year trend means you can plan with more confidence than at any time since 2021. The 275-285 range allows for reasonable budgeting: assume 5% annual Rupee depreciation, hedge anything beyond that with forward contracts available via HBL, UBL, or Meezan Bank. If you're a Pakistani exporter (textiles, leather, sports goods, rice), the new normal means more predictable Dollar earnings — but also means the "windfall" gains from a rapidly depreciating Rupee (which boosted exporter margins in 2022-2023) are gone. You need to compete on productivity, not currency.
For investors in Pakistani assets
The 1-year USD/PKR trend is bullish for Pakistani Rupee-denominated assets (PSX equities, T-bills, PIBs) for two reasons: (1) lower currency volatility reduces the risk premium foreign investors demand, and (2) the gradual 3-5% annual depreciation is more than offset by the 12-15% yield on Pakistani T-bills — creating a real yield of 7-10% for foreign investors. The MSCI Pakistan Index outperformed most emerging markets in 2024 on exactly this thesis. The risks: any delay in IMF reviews, any sharp rise in oil prices, or any political instability could reverse the trend quickly.
For chart analysts and traders
From a technical perspective, the 1-year USD/PKR chart shows:
- Support at 277: This level has been tested multiple times (October 2024, March 2025, July 2025) and held each time. A break below would target 265-270 — the August 2024 pre-EFF rally low.
- Resistance at 285: This level has capped the upside on multiple attempts. A sustained break above would target 290-295 — the psychological threshold above which exporters and expats would shift behavior.
- 50-day moving average above 200-day: A "golden cross" formed in late 2024 (after the IMF EFF) and has held — technically bullish for the Rupee (bearish for USD/PKR).
- Volatility compression: The Bollinger Band width has compressed to its tightest level since 2021 — historically a precursor to a directional breakout. Watch the IMF review calendar (next review ~March 2026) as the most likely catalyst.
For a deeper dive on chart-reading techniques — including candlestick patterns, moving averages, support/resistance, and the interbank-vs-open-market spread as a stress indicator — see our USD to PKR graph guide.
What to watch next: leading indicators
Based on our tracking, here are the four indicators that will determine the next leg of the USD/PKR chart:
- SBP weekly reserves (every Thursday): Below $12 billion = bearish for Rupee; above $16 billion = bullish; above $20 billion = IMF target met, full stabilization.
- IMF quarterly review results (March, June, September, December): Successful reviews = Rupee stability; delayed or conditional reviews = Rupee weakness.
- Brent crude price: Below $80 = bullish for Rupee (lower import bill); above $100 = bearish (renewed pressure on reserves).
- Political stability indicator: Any major political event (election, government change, military reshuffle, judicial crisis) could move the Rupee 3-5% in either direction. Currently stable, but Pakistan's political history cautions against complacency.
The "USD to PKR Chart" FAQ
What does the USD to PKR 1-year trend show?
Over the last 12 months, USD/PKR has traded in a relatively tight 277-285 range, a major shift from the 2022-2023 period when the rate moved from 180 to 300. The 1-year chart shows consolidation and stabilization, driven by the September 2024 IMF $7 billion Extended Fund Facility and SBP reserves rebuilding from $4 billion to $13-15 billion.
Is the Rupee expected to strengthen or weaken against the Dollar in 2025-2026?
Most analysts expect a gradual Rupee depreciation of 3-5% per year, in line with the inflation differential between Pakistan and the US. This would put USD/PKR at roughly 290-295 by end-2026. A sharper depreciation would require an IMF review failure, oil price spike, or political crisis; a strengthening would require SBP reserves reaching $20+ billion and successful reform implementation.
How does the IMF impact the USD/PKR chart?
The IMF Extended Fund Facility provides $7 billion over 37 months, with quarterly reviews. Each successful review unlocks ~$1 billion in tranche disbursements, which rebuild SBP reserves. The IMF also requires Pakistan to maintain a market-determined exchange rate and structural reforms. Successful IMF reviews have historically stabilized the Rupee; failed or delayed reviews have preceded every major PKR crisis since 2018.
What's the difference between the interbank and open-market PKR rate shown on the chart?
The chart above shows the interbank rate (the rate at which Pakistani banks trade Dollars with each other and the SBP). The open-market or cash rate, used by money-changer dealers in Pakistani bazaars, is typically 1-3 PKR weaker (more PKR per USD). Since the September 2024 IMF EFF, the gap has narrowed from 18 PKR (peak crisis) to roughly 3-5 PKR — a key sign of stabilization. The chart's recent low volatility reflects this narrowed gap.
Track USD/PKR live and historically
Use the converter and chart at the top of this page to check the live rate and view historical trends across multiple timeframes. Whether you're a Pakistani expat in Toronto timing a remittance, an importer in Karachi hedging a Dollar shipment, or a portfolio manager watching Pakistan's emerging-market assets — the chart above updates in real time, and our historical view lets you compare today's rate against the last week, month, year, and decade. Bookmark this page and set a free rate alert for your target threshold. For the live interbank rate and the full historical chart, see our USD to PKR pair page. For a deeper technical analysis of the chart itself — including candlestick patterns, moving averages, and chart-reading techniques — see our USD to PKR graph guide. And for the timing question (when to actually send money), our best time to convert USD to PKR guide has the full weekly and monthly cycle data plus a 7-step decision framework.