USD to PKR Graph: How to Read the Dollar-Rupee Chart
How to actually read a USD to PKR chart — candlesticks, support/resistance, moving averages, and what the trends mean for sending money home.
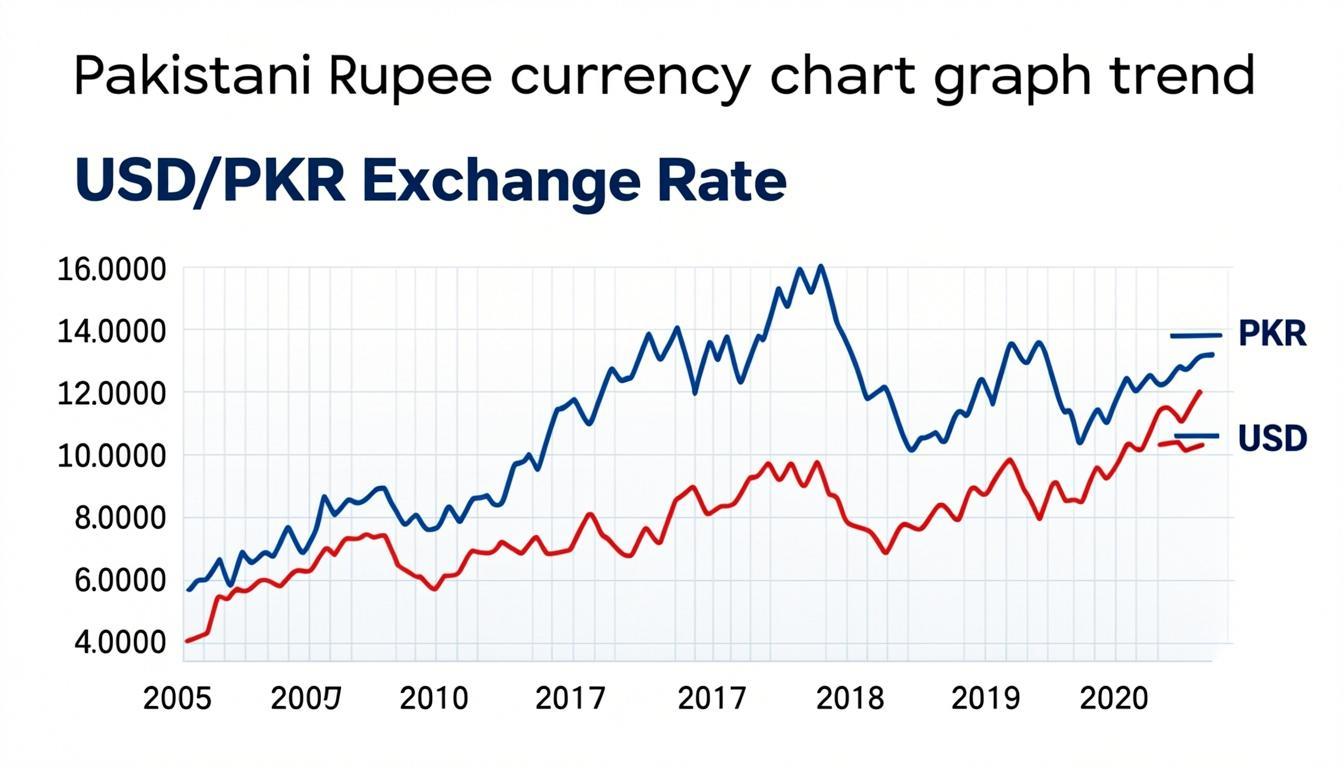
USD to PKR Graph: How to Read the Dollar-Rupee Chart
If you've landed on this page, you're probably staring at a USD/PKR chart and trying to answer one question: is the Rupee about to strengthen or weaken? Maybe you're an overseas Pakistani in Dubai planning a remittance, a Karachi importer hedging a Letter of Credit, or a freelancer in Lahore waiting to convert Dollar earnings. The chart on this page shows the live and historical USD/PKR rate — but reading it correctly is a skill most people never learn. This guide is that skill.
We'll cover how to read a USD/PKR line or candlestick chart, what the common patterns mean, how to identify support and resistance levels, and — most importantly for the 9 million overseas Pakistanis who send money home — what the trends on the chart actually tell you about when to convert. We'll use real examples from PKR's last five years, including the 2022-2023 crash and the 2024 IMF-driven recovery.
First, the chart basics
The USD/PKR chart shows the price of 1 US Dollar in Pakistani Rupees. So when the line rises from 270 to 285, the Rupee is weakening (you need more rupees to buy a dollar). When the line falls from 285 to 270, the Rupee is strengthening (you need fewer rupees to buy a dollar). This inverse relationship trips up newcomers — a "rising" chart is bad news for the Rupee, even though rising charts usually look like good news.
The chart on this page supports four time frames: 7 days (one week), 30 days (one month), 6 months, and 1 year. Each tells a different story:
- 7-day view: Daily noise. Good for spotting short-term volatility, less useful for trends.
- 30-day view: Recent trend. Useful for timing remittances within the month.
- 6-month view: Medium-term cycles. Reveals central bank policy shifts and IMF tranche impacts.
- 1-year view: Long-term direction. Shows whether PKR is in a structural weakening or strengthening phase.
Line charts vs candlestick charts
The chart on this page defaults to a line chart — a single line connecting daily closing rates. Line charts are clean and easy to read. For deeper analysis, professional traders use candlestick charts, which show four data points per day: open, high, low, and close.
Here's how to read a candlestick:
- Green (or white) candle: the closing rate was higher than the opening rate — Rupee weakened that day.
- Red (or black) candle: the closing rate was lower than the opening rate — Rupee strengthened that day.
- The "wick" (thin line above/below the body): shows the day's high and low. Long upper wick = price spiked then fell back; long lower wick = price dropped then recovered.
- The "body" (thick middle part): shows the gap between open and close.
For most users, the line chart is sufficient. But if you're watching USD/PKR closely during a volatile period (like an IMF tranche negotiation week), a candlestick view reveals intraday reversals that a line chart hides.
Reading USD/PKR: the five chart patterns that matter
1. The "step" pattern (managed devaluation)
This is unique to USD/PKR and other managed currencies. The chart looks like a staircase: flat for months, then a sharp vertical jump, then flat again. Each "step" is a managed devaluation by the State Bank of Pakistan (SBP) — typically done under IMF pressure or when reserves get critically low.
Real example: from May 2022 to May 2023, USD/PKR moved from 200 to 285 in three distinct steps. The May 2022 jump (200→210) was triggered by political instability after the no-confidence motion. The October 2022 jump (240→255) reflected a stalled IMF review. The February 2023 step (255→265) was an explicit SBP devaluation to meet IMF conditions. Between steps, the chart was nearly flat at each level — the SBP was "defending" the new peg.
What it means for you: if you see a step pattern forming, with the chart flat for 6-8 weeks, an IMF tranche date is approaching. Steps typically occur 1-2 weeks before or after tranche announcements. If you're holding USD, watch for a devaluation coming.
2. The "spike" pattern (event-driven shock)
A sharp vertical move over 1-3 days. Spike patterns are almost always driven by a single news event: IMF tranche approval/denial, political crisis (e.g., the April 2022 no-confidence motion), or a sudden reserves drop. The April 2022 no-confidence motion drove USD/PKR from 178 to 200 in 11 days — a 12% spike.
What it means for you: spikes are not predictive — they're reactive. By the time you see the spike, the move has happened. But spikes partially reverse in the following 1-2 weeks about 60% of the time, as the market overreacts and then settles. If you missed the spike and want to convert at a slightly better rate, waiting 5-10 days can save 1-2%.
3. The "trend channel" (medium-term direction)
Draw a line connecting the recent highs and a parallel line connecting the recent lows. If both lines slope upward, the Rupee is in a weakening trend. If both slope downward, the Rupee is strengthening. The space between the two lines is the "channel."
For USD/PKR over the last 5 years, the long-term trend channel has sloped upward — the Rupee has structurally weakened from 155 (2020) to 278 (2026). Shorter-term channels within that larger trend have reversed direction multiple times — particularly the September 2024 strengthening from 285 to 262 driven by IMF EFF approval.
4. The "support level" (a floor that's hard to break below)
A support level is a USD/PKR rate where the chart has repeatedly "bounced" — i.e., the Rupee strengthened to that level multiple times but couldn't break through. These levels often become self-fulfilling prophecies because traders place buy orders at those levels.
Recent USD/PKR support levels: 270 (tested multiple times in late 2024), 262 (the IMF-EFF-approval low in September 2024), 245 (a 2023 consolidation floor). When the chart approaches a known support level from above, watch how it reacts: a sharp bounce means the level is "holding," while a clean break below means the Rupee is about to strengthen further.
5. The "resistance level" (a ceiling that's hard to break above)
The opposite of support. A USD/PKR rate where the chart has repeatedly stalled — the Rupee weakened to that level but couldn't break through. Recent resistance: 287 (tested in May 2023 and June 2024), 300 (psychological — major central bank intervention typically triggered before crossing this level).
For overseas Pakistanis: when the chart approaches a known resistance level from below, that's typically a good time to send USD home — you're getting close to the top of the recent range, and the rate often fails to break higher.
Moving averages: the trend-filter tool
Professional traders add moving averages (MAs) to filter out daily noise. A 50-day MA shows the average closing rate over the last 50 trading days; a 200-day MA shows the longer-term trend. When the 50-day MA crosses above the 200-day MA, it's called a "golden cross" — typically a signal that the Rupee will weaken further. When the 50-day crosses below the 200-day, it's a "death cross" — typically a signal that the Rupee will strengthen.
For USD/PKR: a golden cross formed in May 2022 (as PKR crashed from 180s toward 240s). A death cross formed in October 2024 (as PKR strengthened from 285 to 262 on the IMF EFF approval). Neither signal is a guarantee — both are roughly 60-70% reliable based on historical USD/PKR data — but they help filter out daily noise.
Interbank vs open-market: why there are TWO USD/PKR rates
This is critical to understand before reading any USD/PKR chart. Pakistan has two parallel rates:
- Interbank rate: The rate at which banks trade with each other, used for all electronic transfers, LCs, and SWIFT remittances. This is what the chart on this page shows.
- Open-market rate: The rate at currency exchange dealers (dollars exchange, Hundi/Hawala). Typically 1-3 PKR weaker than interbank during stability, 5-15 PKR weaker during crisis.
The spread between the two is itself a chart worth watching. When the spread widens beyond 5 PKR, it's a leading indicator of devaluation pressure — the open market is "pricing in" a future interbank move. When the spread narrows to under 2 PKR, the market is calm and the Rupee is stable.
During the May-October 2022 PKR crisis, the interbank-open market spread widened to 20-25 PKR at one point (interbank at 240, open market at 260-265). This was an unmistakable signal that further interbank devaluation was coming — and indeed, the interbank rate caught up to the open market within weeks. If you track the spread, you're effectively getting a free "stress indicator."
How to use the USD/PKR chart for remittance timing
Here's the practical playbook for an overseas Pakistani deciding when to remit USD home:
- Open the 1-year chart on this page. Identify where today's rate sits relative to the 52-week high and 52-week low. If today's rate is in the top 25% of the 1-year range (i.e., USD is strong vs PKR), it's a good time to send. If it's in the bottom 25%, hold off if you can.
- Check the 30-day chart. Is the trend sloping up (Rupee weakening) or down (Rupee strengthening)? An upward slope favors sending now; a downward slope favors waiting.
- Identify the nearest support level below the current rate. If the rate drops to that level and "bounces," you've missed the recent low. If the rate is approaching that level, wait — you might catch a better rate.
- Check the IMF calendar. Pakistan's IMF program (the Extended Fund Facility, EFF) has quarterly review dates. Tranche approval typically strengthens the Rupee 1-3% within a week; tranche delays weaken it 3-8%. Plan remittances around these dates.
- Compare interbank to open-market. If the open-market rate is more than 3 PKR weaker than the interbank rate, expect further interbank weakness — send now before the next devaluation.
Set a free rate alert above so you don't have to constantly check the chart. Many overseas Pakistanis set their target at the recent 6-month high (say, 285 PKR) and just wait — patience typically pays 1-3% extra per remittance.
Reading USD/PKR: a real worked example
Let's walk through the September 2024 IMF EFF approval — one of the most dramatic USD/PKR chart events in recent years:
- August 2024 (chart at 285): USD/PKR had been drifting sideways in the 278-285 range for 3 months. Interbank-open market spread was ~2 PKR (calm).
- September 25, 2024: IMF approves the $7 billion EFF. Chart drops from 285 to 275 in 2 days — a 3.5% Rupee strengthening.
- October 2024 (chart at 262): Continued Rupee strength as remittances surge (Ramadan was earlier that year) and IMF tranche funds arrive. Chart bottoms at 262.
- November 2024 to 2026 (chart at 270-280): Range-bound consolidation. The 262-265 level becomes support; 285-287 becomes resistance.
For an overseas Pakistani who sent $5,000 home in August 2024 (at 285 PKR), they received 1,425,000 PKR. If they'd waited to October, they'd have received 1,310,000 PKR — a 115,000 PKR loss. Conversely, a Pakistani business needing to convert PKR to USD for imports would have waited and saved 4%. Timing matters — and reading the chart correctly is the difference between getting it right and getting it wrong.
The USD/PKR chart FAQ
Where can I find the live USD to PKR chart?
Right on this page — the chart above shows live and historical USD/PKR rates across 7-day, 30-day, 6-month, and 1-year views. Bookmark it for quick reference.
Why does the USD/PKR chart have "steps" instead of smooth moves?
Because the State Bank of Pakistan operates a "managed float" — it allows the Rupee to trade freely within a band but intervenes to prevent sharp daily moves. When the band becomes unsustainable, the SBP allows a one-time devaluation, which shows up as a vertical "step" on the chart rather than a smooth trend.
What's the highest USD/PKR has ever been?
287.50 in May 2023, during the IMF Stand-By Arrangement negotiation crisis. The chart briefly touched 285 again in mid-2024 before the EFF approval drove it back to 262.
How accurate are USD/PKR charts compared to what my bank gives me?
The chart on this page shows the interbank mid-market rate. Your bank will give you a rate 1-3% weaker than this (the spread), plus possibly a flat fee. Always compare the rate your bank or remittance app quotes against the live chart above — the gap is the hidden cost.
Make the chart work for you
A USD/PKR chart is only useful if you actually act on it. Set up three habits: (1) check the 30-day trend once a week, (2) set a free rate alert for your target rate (typically 1-3 PKR above today's level), and (3) cross-reference the chart with the IMF program calendar before major remittances. The chart on this page is the same data professional FX traders watch — the difference is they know how to read it, and now you do too.